
jifto Sunlight

Analysis modes
jifto Sunlight provides two distinct analytical lenses that serve complementary purposes in design workflows.
| Mode | Sun hours | Shadows |
|---|---|---|
| Appearance |
Direct sun
Energy
|
Single
Multiple
|
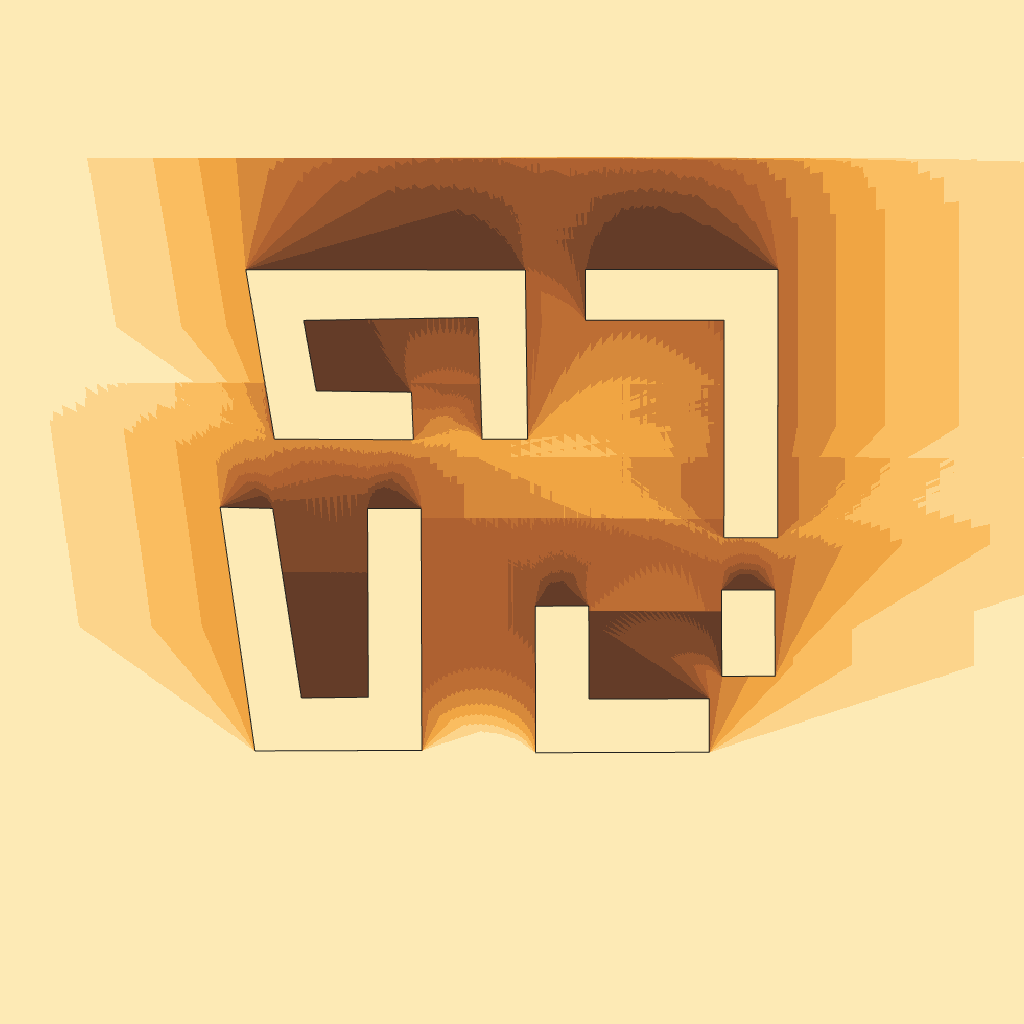
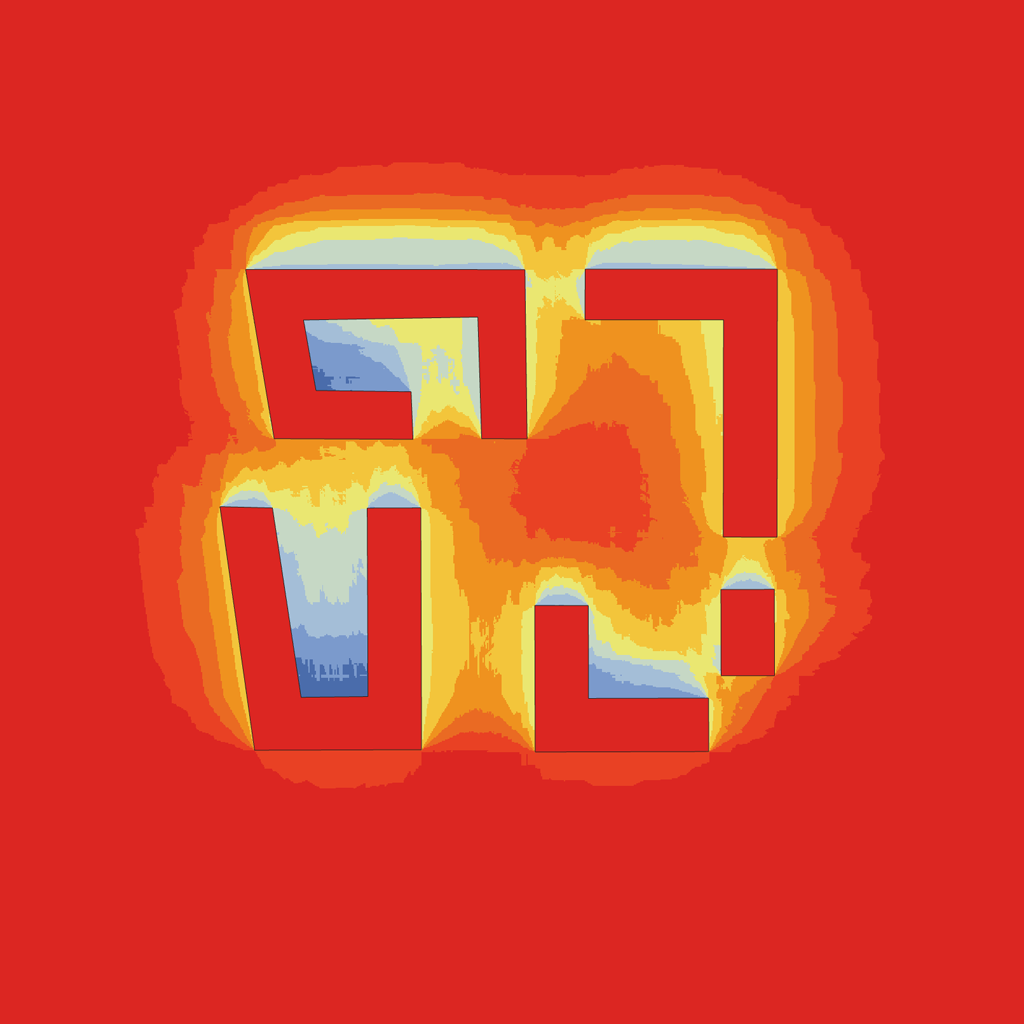
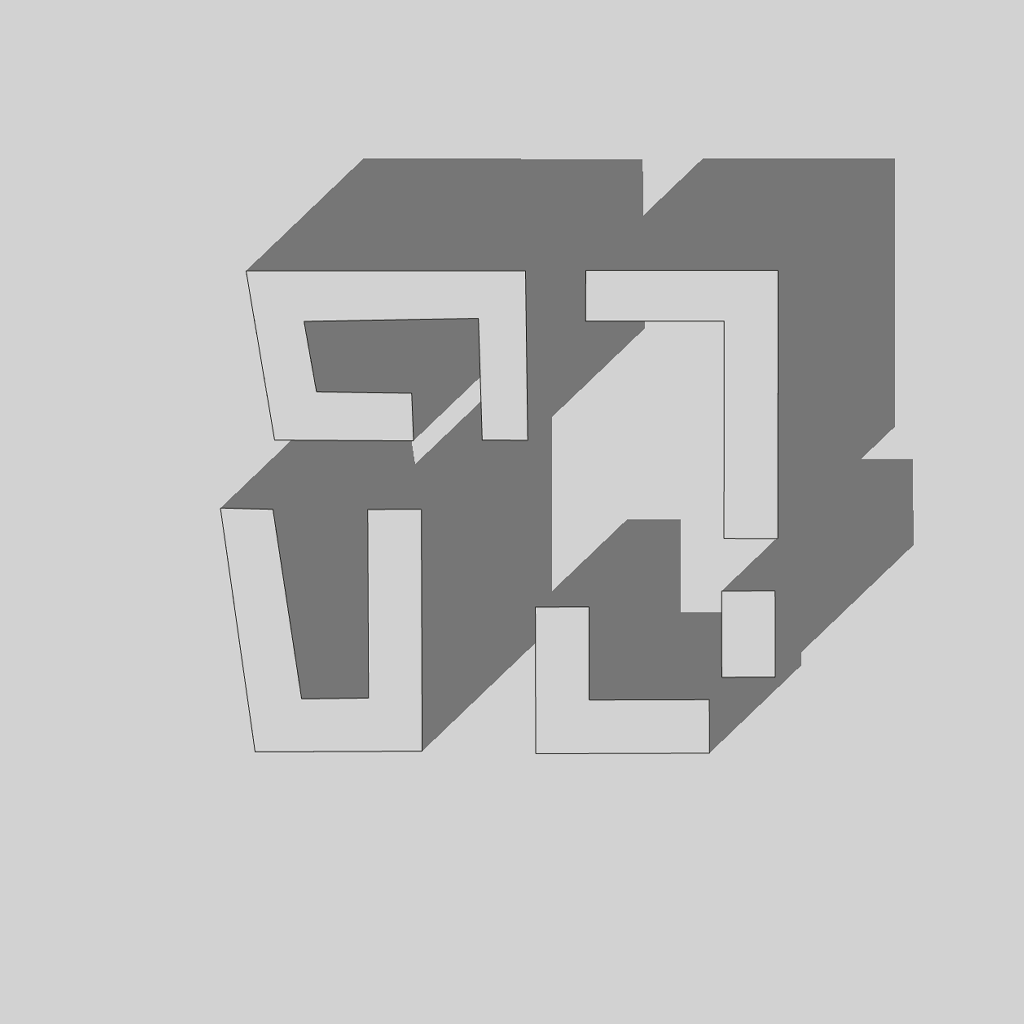
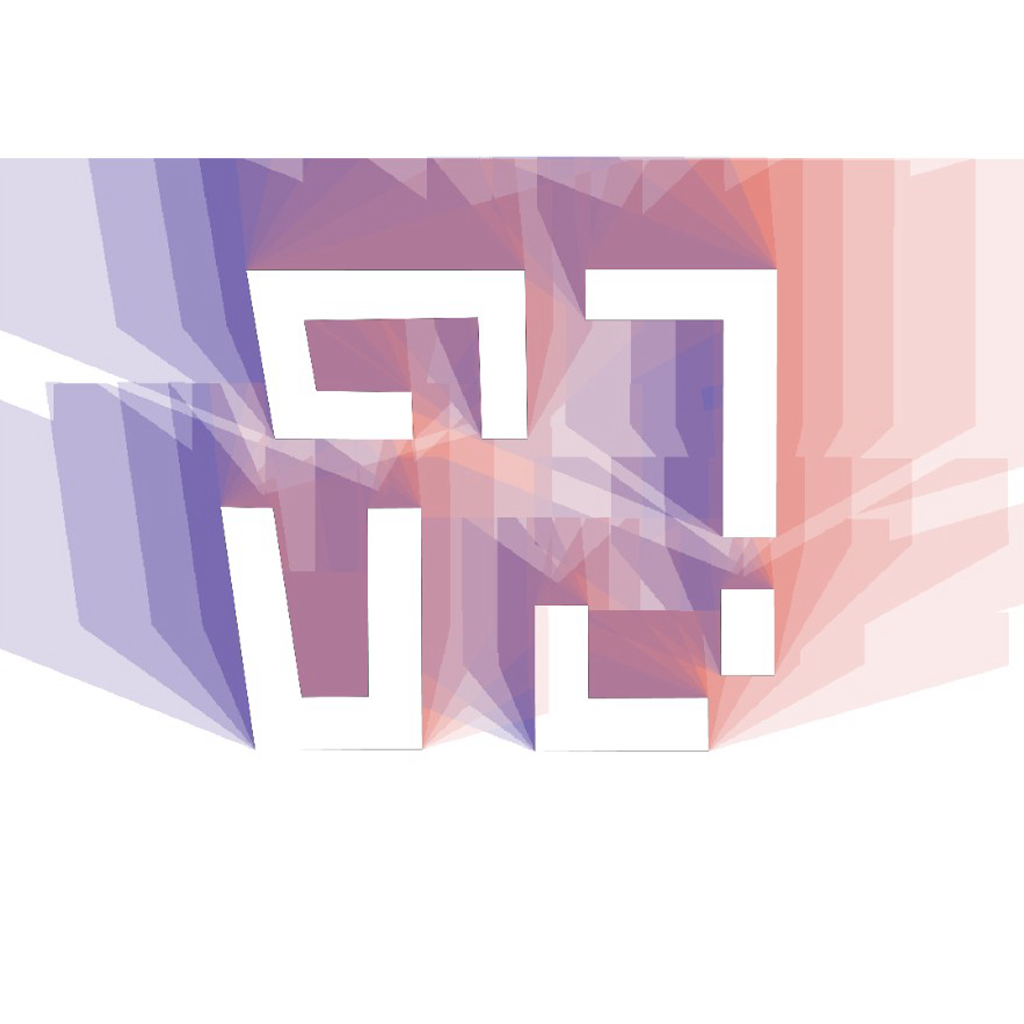
| Computes | Cumulative direct sun or energy over a day or date range. | Instantaneous shadow cast at a date, time, or time range. |
| Output |
|
|
| Statistics |
hours m² % 0 – 1 4953.2 9% 1 – 2 1132.7 2% 2 – 3 1517.3 3% 3 – 4 2379.7 5% 4 – 5 4530.2 9% 5 – 6 2699.9 5% 6 – 7 3704.8 7% 7 – 8 2561.1 5% 8 – 9 3303.1 6% 9+ 25697.9 49% Total 52479.9 100 kWh/m² m² % 0 – 100 532.1 1% 100 – 200 1304.8 2% 200 – 300 1449.2 3% 300 – 400 3443.3 7% 400 – 500 2511.8 5% 500 – 600 3990.5 8% 600 – 700 3807.3 7% 700 – 800 2454.7 5% 800 – 900 3978.0 8% 900+ 29008.3 55% Total 52479.9 100 |
m² % Shadowed 15263.7 29% Sunlit 37216.2 71% Total 52479.9 100 m² % Never shadowed 30055.4 57% AM only 6117.4 12% PM only 4968.6 9% AM + PM 11338.5 22% Total 52479.9 100 |
How sun hours are calculated
For every time step within the analysis period, jifto computes the sun's azimuth and altitude based on the geographic location of the site. This is done using standard solar geometry (NOAA / Astronomical Algorithms) that accounts for latitude, longitude, and the date. The sun is considered above the horizon when its altitude exceeds 0°.


At each time step, a ray is cast from every measurement point on the analysis surface toward the computed sun position. If the ray intersects any geometry – a building, roof, or other opaque surface – the point is recorded as shaded for that time step. If the ray reaches the sky unobstructed, the point is recorded as receiving direct sun.
This method uses NVIDIA OptiX GPU-accelerated ray tracing. The binary nature of the check at each discrete time step means that the sun-hours total is always an approximation of the continuous analytical result, with accuracy determined by the time-step interval.
The total sun hours at each point is computed by counting the number of time steps for which the point received direct sun, then multiplying by the time-step interval in hours. With a 60 min step, a point lit at 9 of 12 sampled times accumulates 9 h.
-
STEP 01Compute sun position at each time step, sunrise to sunset.
-
STEP 02From each measurement point, cast a ray toward the sun.
-
STEP 03Record sun (1) or shade (0) for the point at that time step.
-
STEP 04Sum all sun-steps and multiply by time-step duration.
-
STEP 05Render the result as a colour map; aggregate into hour-band statistics.
Grid resolution & time step effects
Grid placement
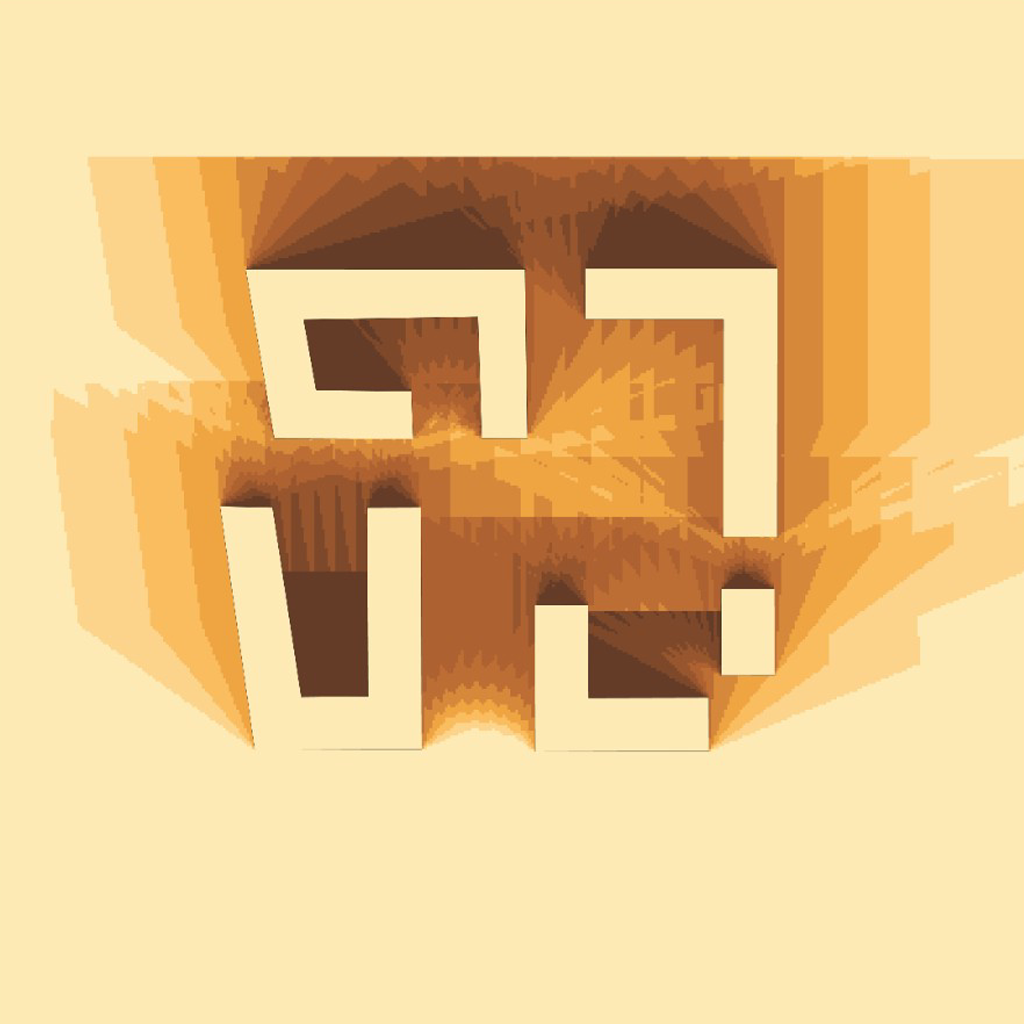
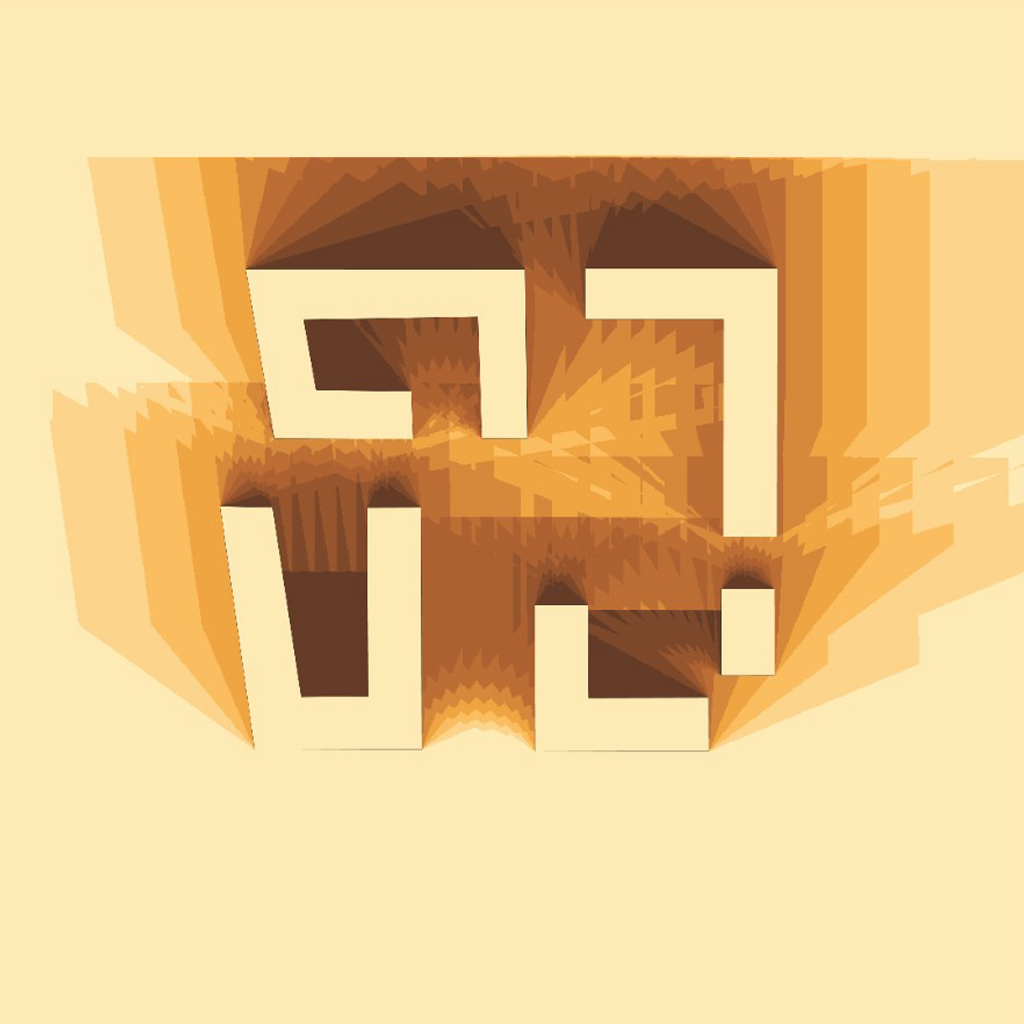
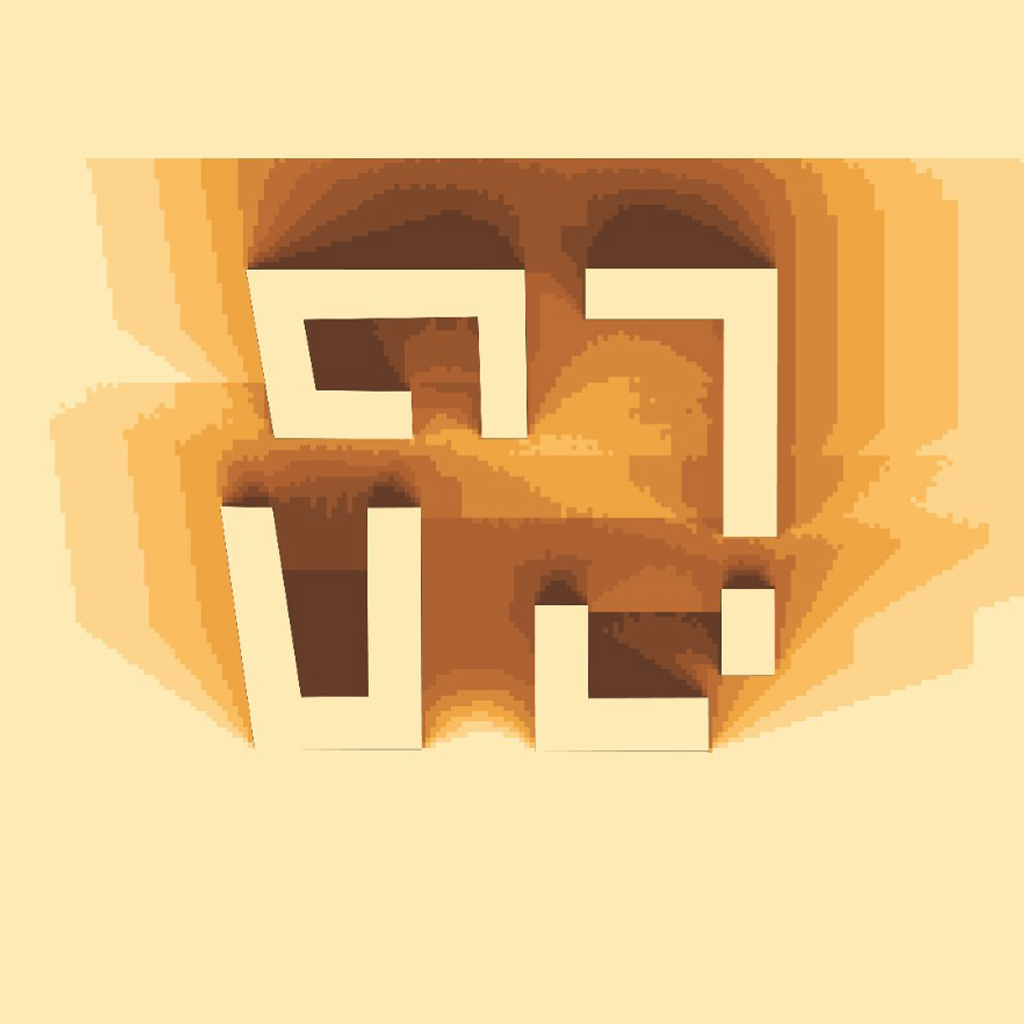
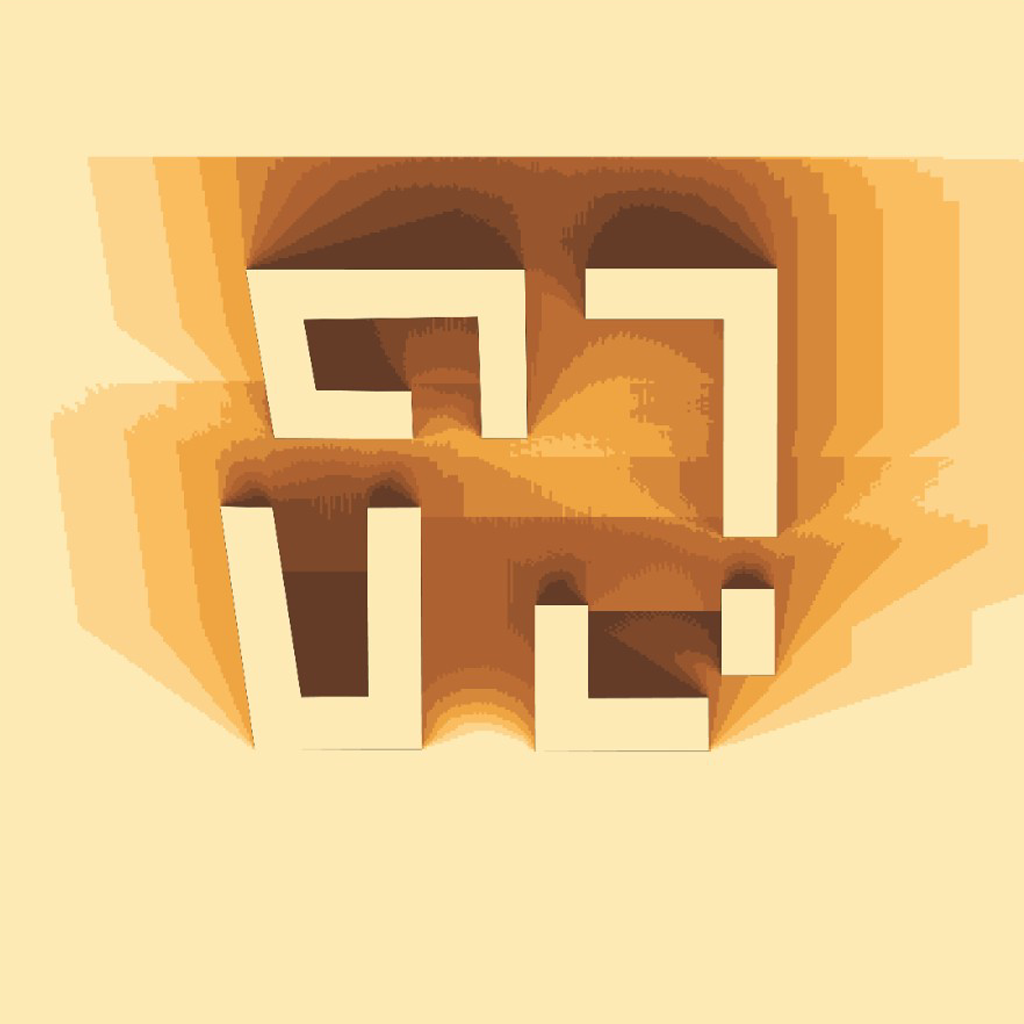
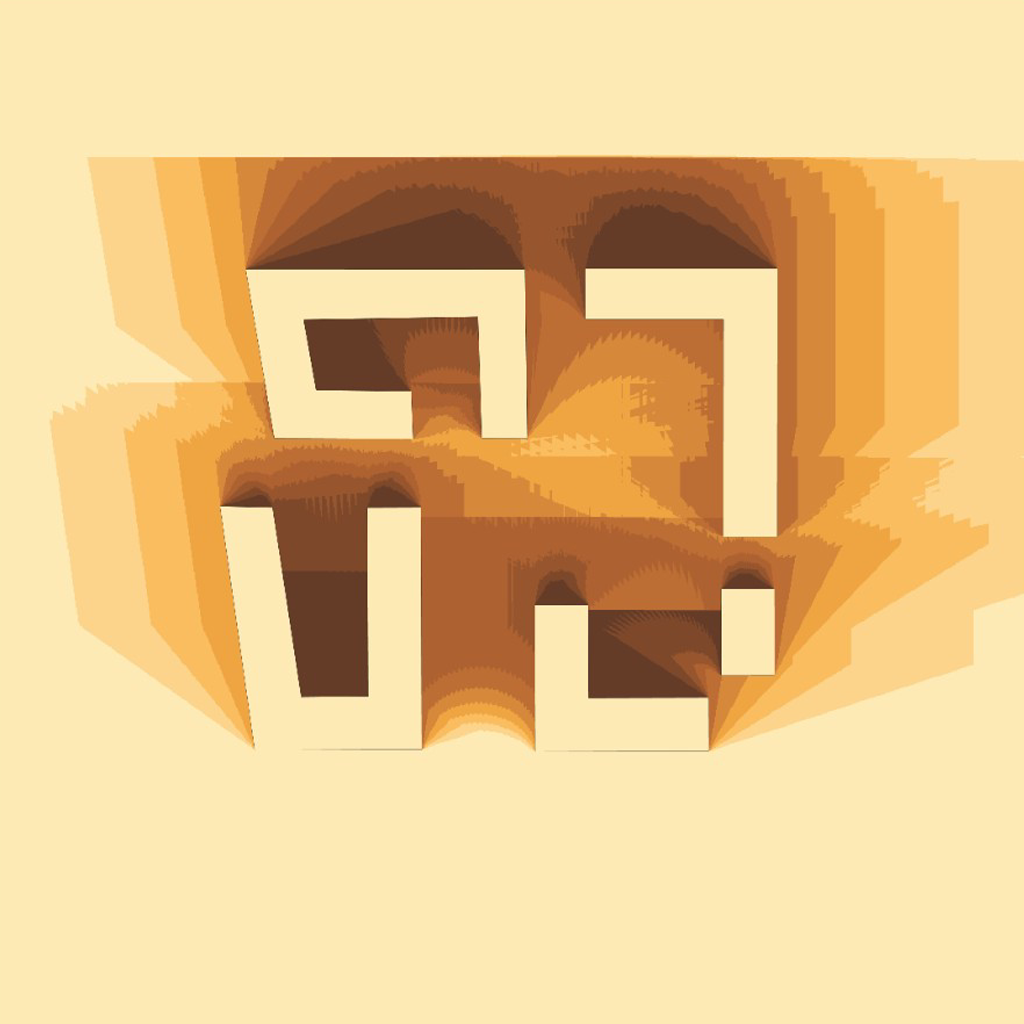
Analysis points are distributed in a Cartesian grid across all surfaces of analysis objects. On rectangular facades, the grid aligns cleanly with the surface. On non-rectangular surfaces (angled, curved, or complex geometries), the grid may not fully cover every facet, and small uncovered areas can appear in the result.


Grid resolution
The grid resolution determines how densely the surface is sampled during the analysis. The default resolution is 1.0 m, meaning one measurement point per square metre of surface area.
At coarse resolutions, each point represents a larger area, so shadow edges cannot be captured precisely. If a shadow boundary passes through a grid cell, the entire cell is typically classified as either sunlit or shaded, which may introduce inaccuracies near shadow edges – especially at low sun angles.
Finer grids (e.g. 0.5 m or 0.20 m) reduce this boundary error and produce more accurate results around complex geometry, but increase computation time. The grid resolution can be adjusted in the Advanced Settings (Expert mode).
Time step
The time step defines how frequently the sun position is evaluated.
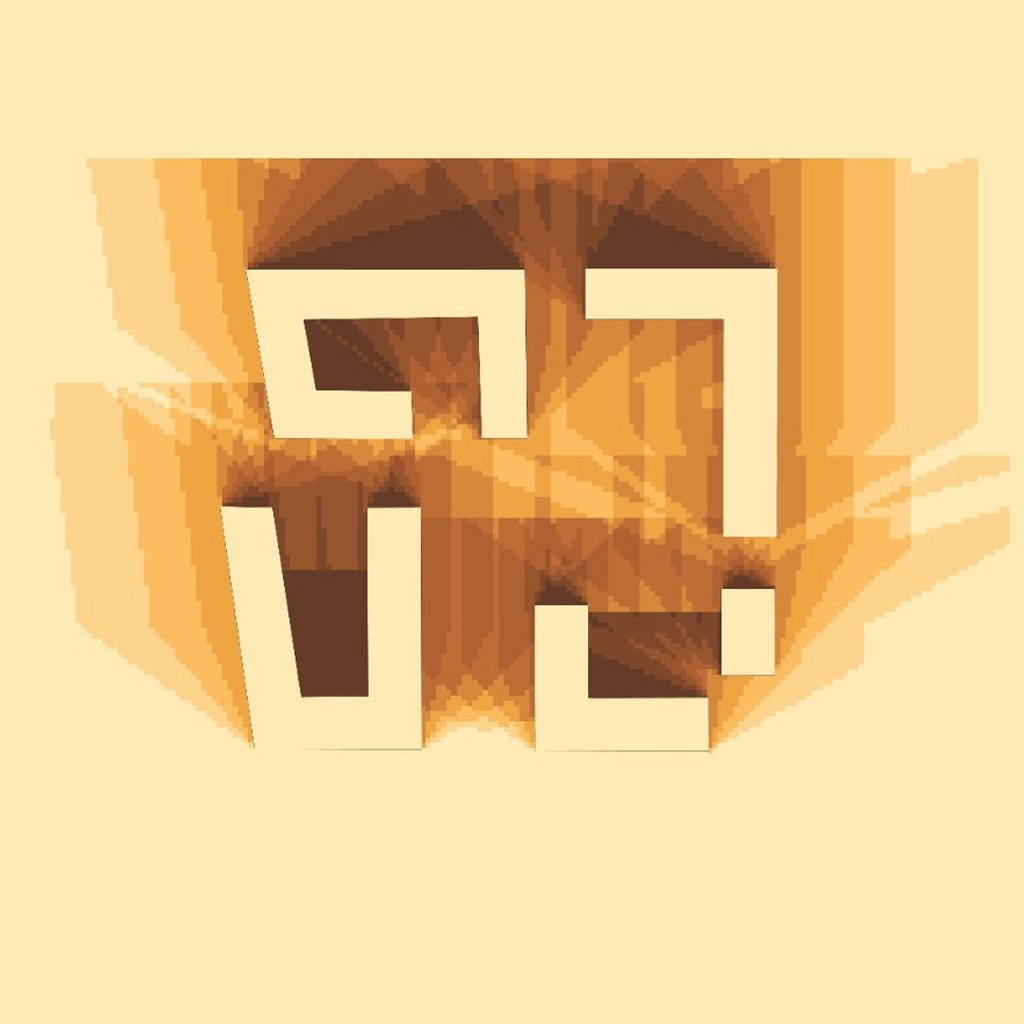
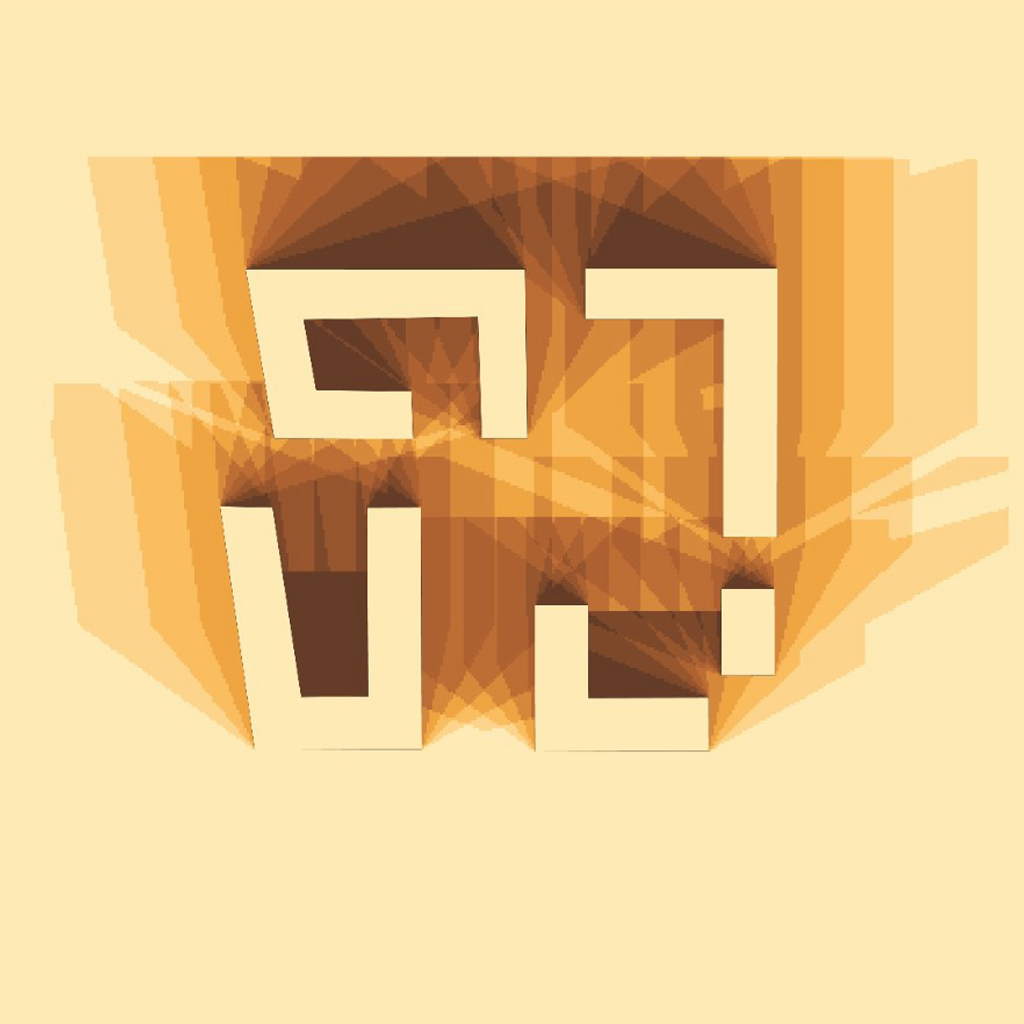
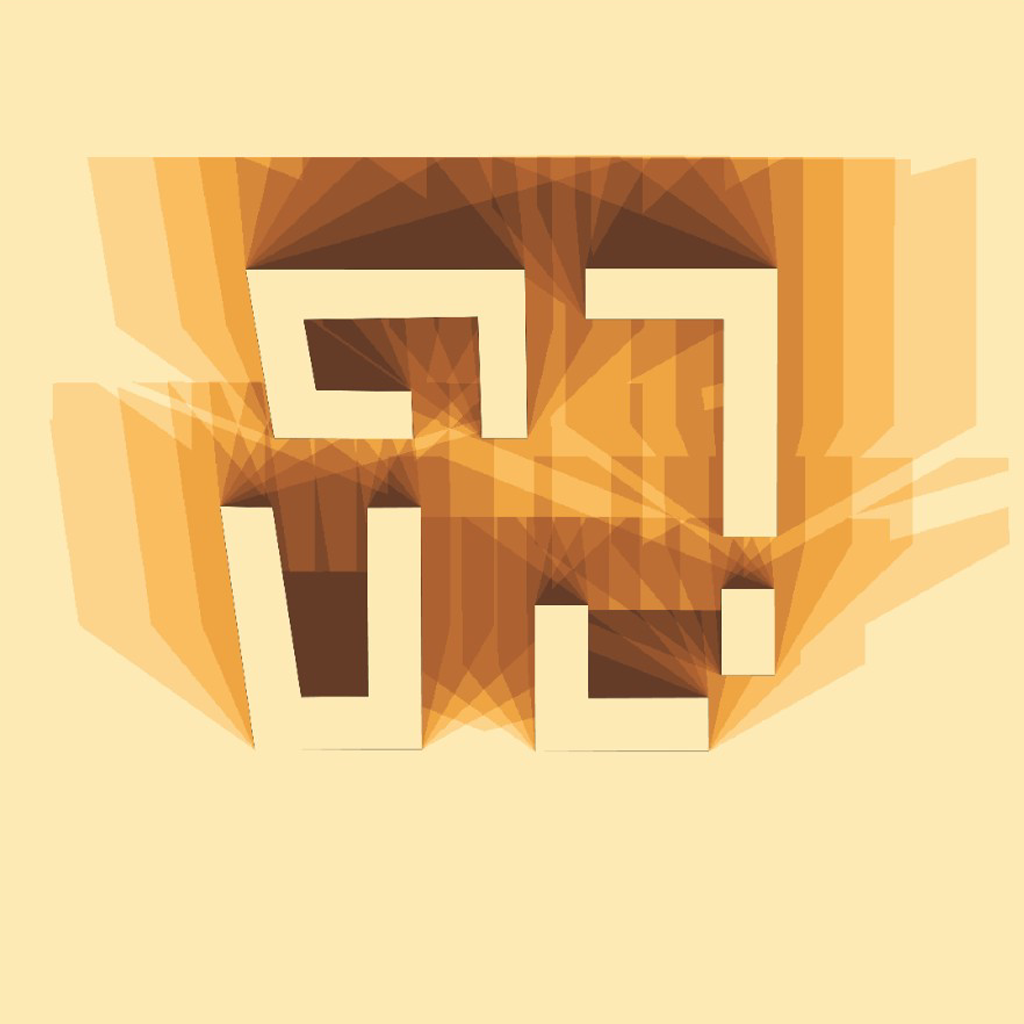
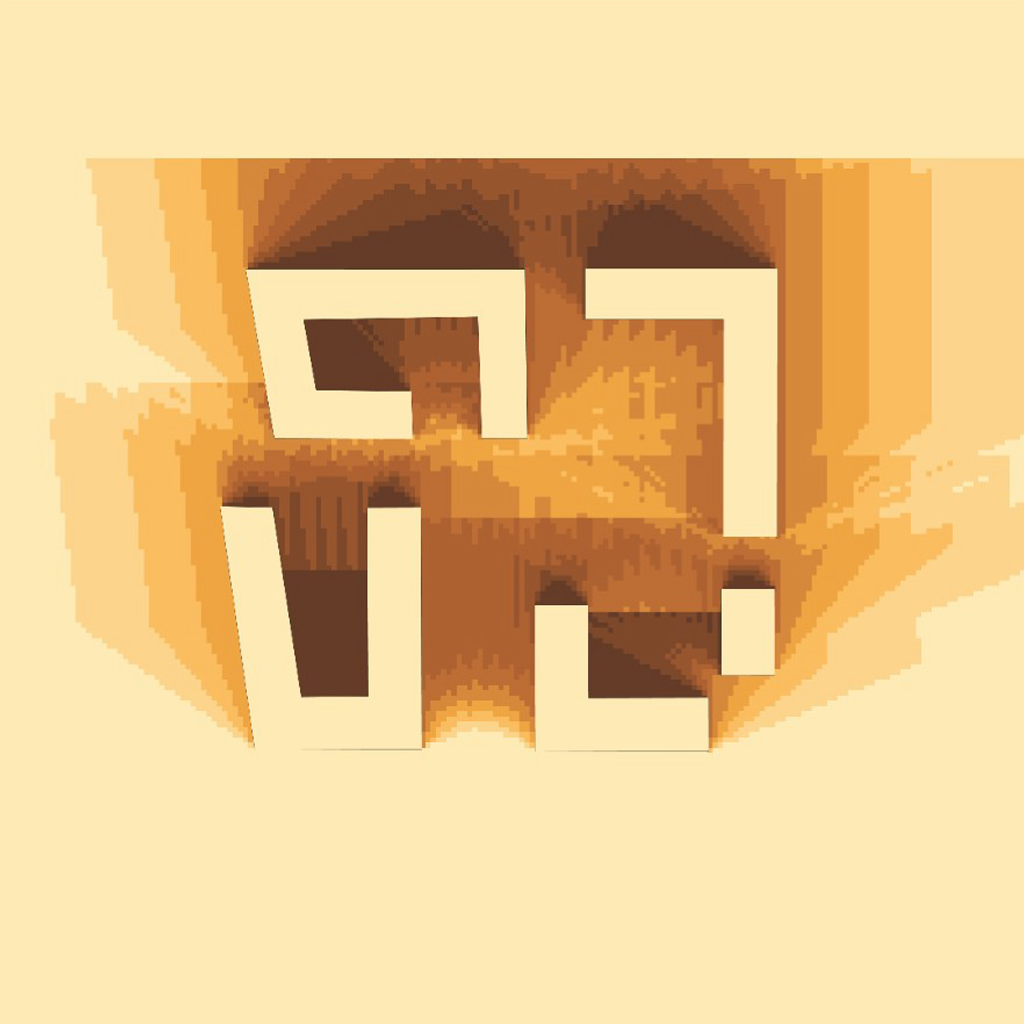
With a 60-minute time step, the simulation checks conditions at 08:00, 09:00, 10:00, etc. If shading starts or ends between two checks, the exact transition time is not captured. Therefore, the timing of shadow changes may be inaccurate by up to one time-step interval.
In practice, for typical urban massing studies, a 60-minute time step produces results that are accurate to within roughly ±0.5 hours per point across a full day.
Key assumptions
The following assumptions govern what jifto Sunlight includes and excludes from the analysis. Understanding these is essential for correctly interpreting results and for avoiding over-reliance on the tool in contexts where excluded factors are significant.
Surface material
All analysis objects and context objects are treated as opaque blockers. Glazing is not modelled as partially transmissive.
Terrain
If included as context geometry, the ground contributes to shading calculations. Terrain elevation can also affect shadows cast by surrounding objects.
Trees
Any imported jifto tree is treated as opaque solid mass, not as a semi-transparent canopy, and it changes according to seasons.
Cloud cover & weather
Direct sun and shadow analyses always assume a clear sky, so results represent the maximum possible direct sun. Energy analysis can instead use historical weather data or a preset sky condition – clear, overcast, or cloudy.
Reflected radiation
Reflected light from adjacent surfaces and sky diffuse radiation are excluded.
Daylight saving time
Sun positions are sampled for clock time relative to the site's timezone. When DST changes within the analysis period, the 24-hour day is taken as the 24 hours before noon of the selected date.
Geographic location
Sun position is calculated from the site's latitude and longitude, ensuring local solar angles are correctly applied for any project location worldwide.
Comparison with other tools
The same test scene was analysed in jifto, Autodesk Forma, and Ladybug Tools. Visual output and statistics are compared below.
- Weather Data
- DNK_Copenhagen.061800_IWEC.epw
- Time step
- 10 min
- Grid size
- 0.2 m
- Weather Data
- Unknown
- Time step
- 6 min
- Grid size
- Unknown
- Weather Data
- DNK_Copenhagen.061800_IWEC.epw
- Time step
- 10 min
- Grid size
- 0.2 m
Direct sun
Equinox day – 20 March, 08:00 – 18:00
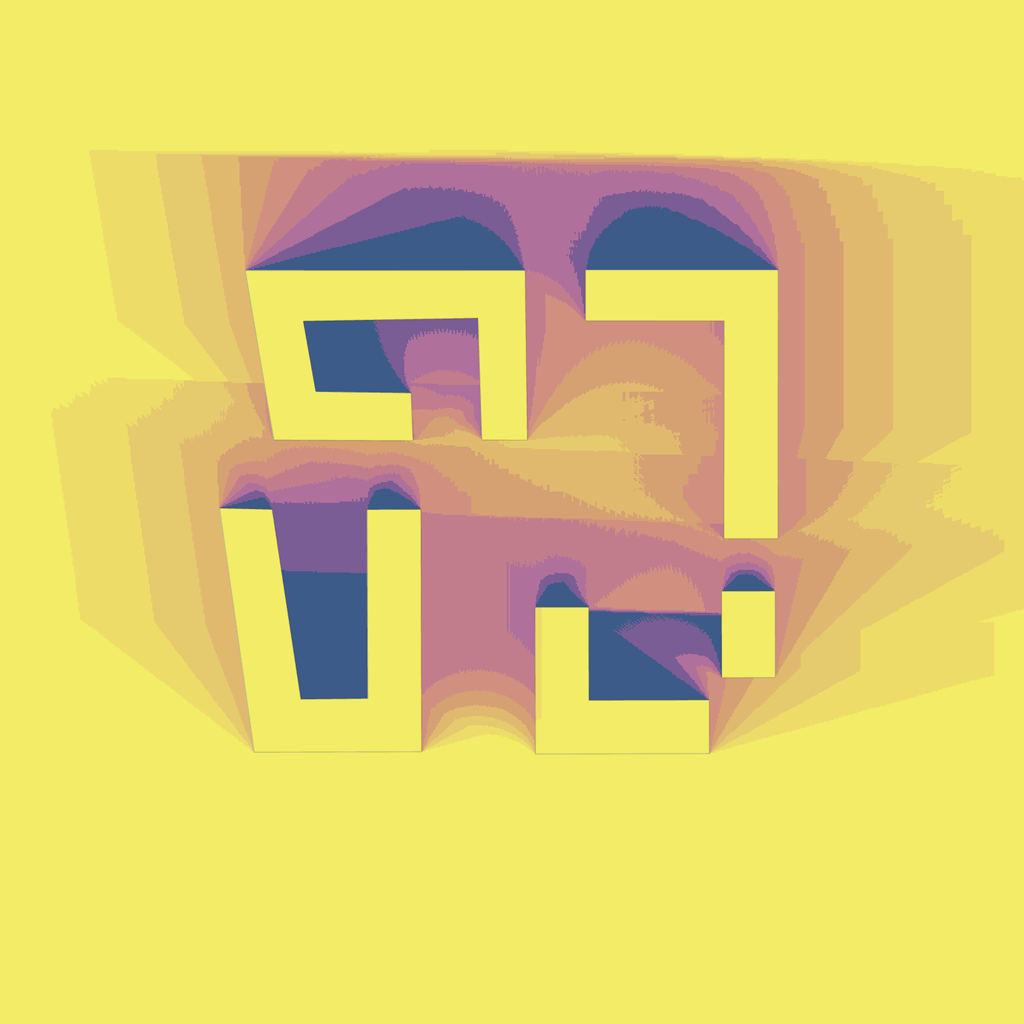
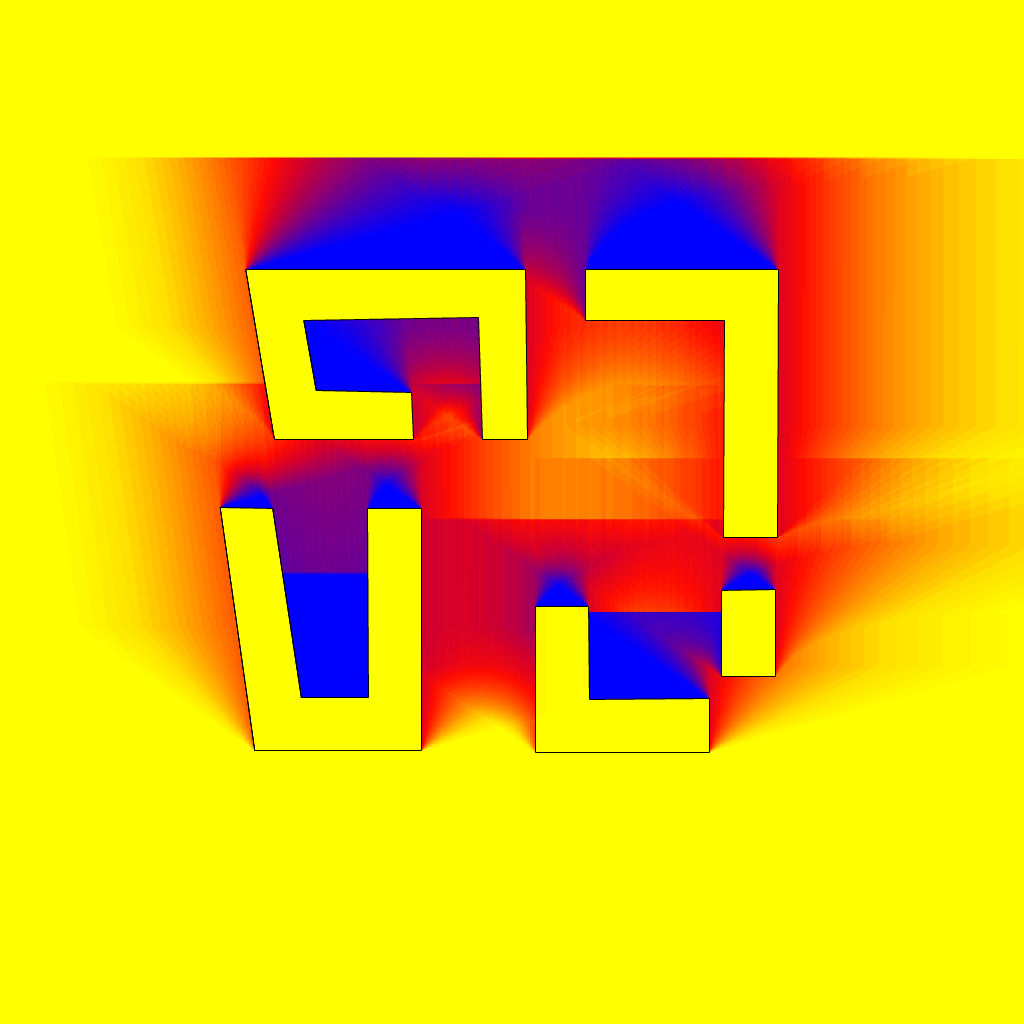
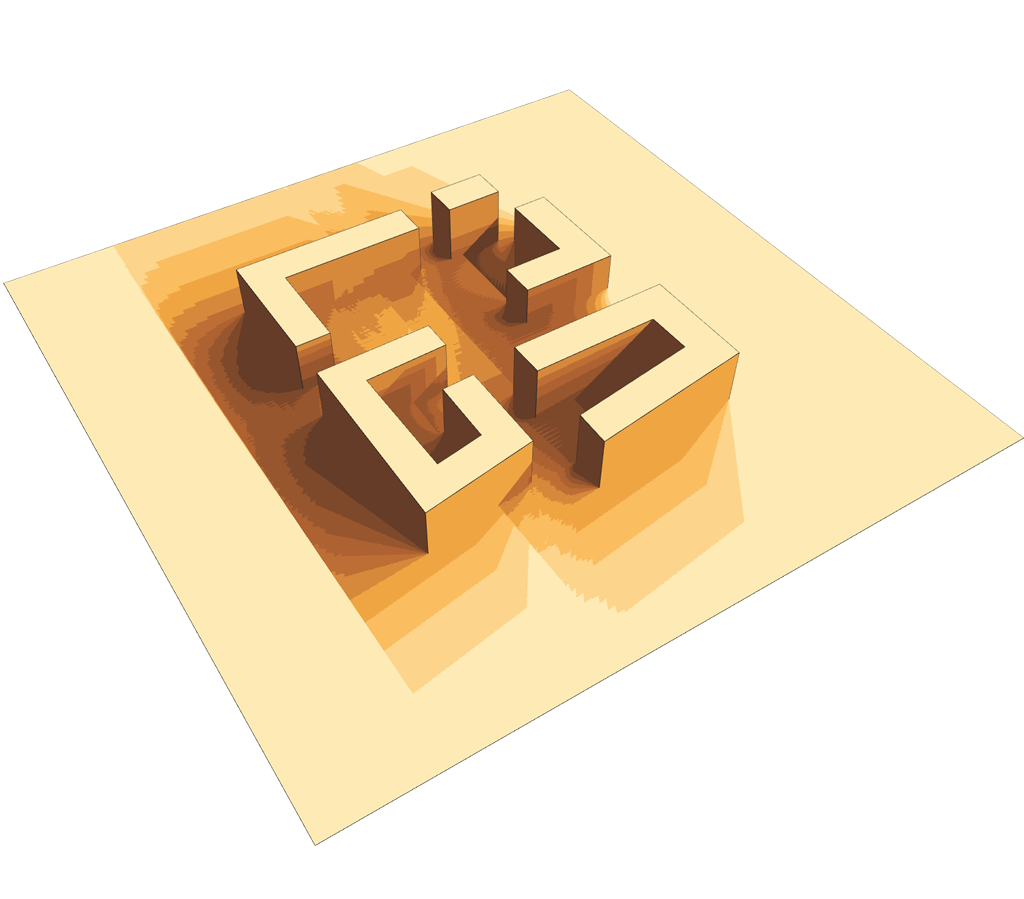
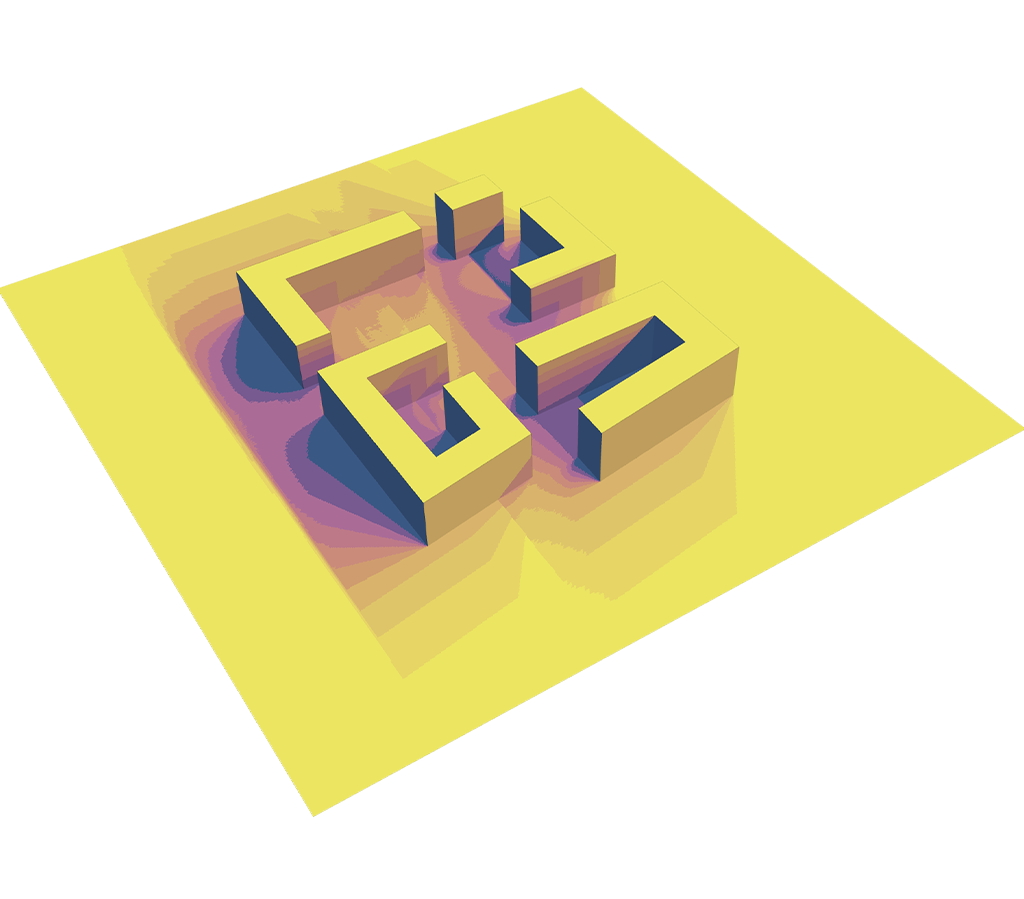
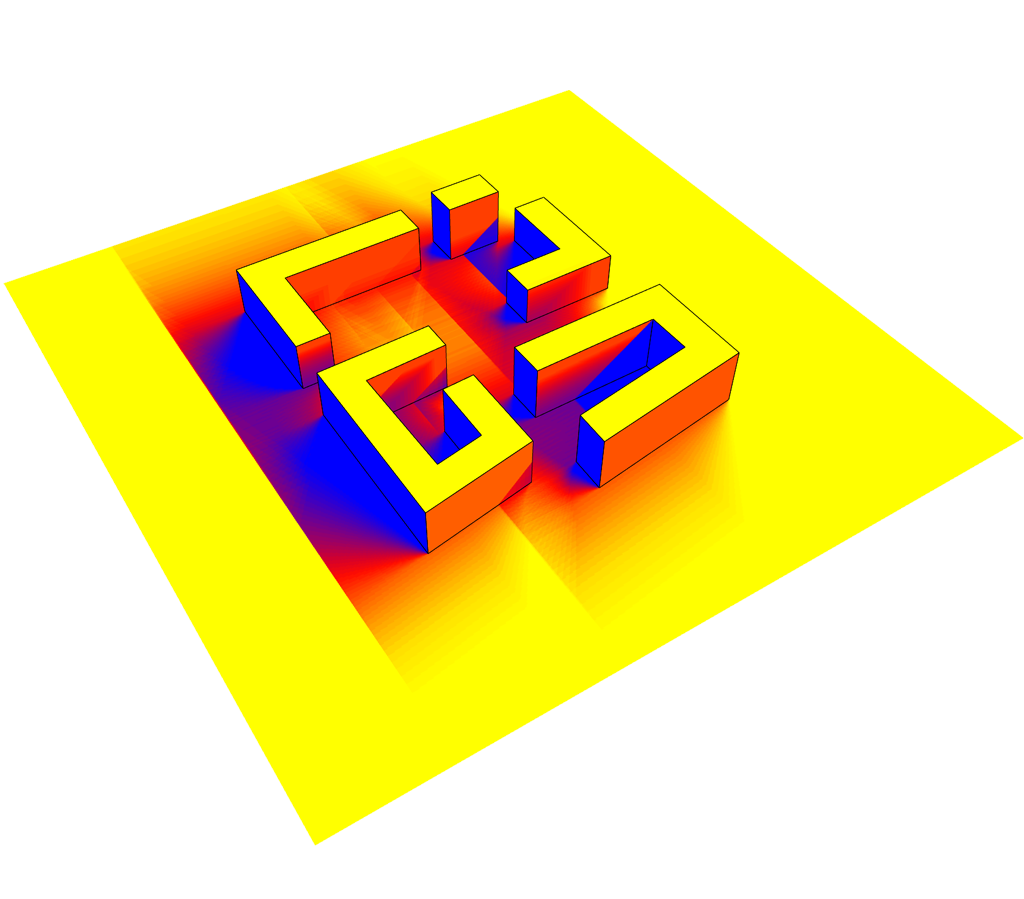
Area distribution by sun-hour band (m² and % of total analysed surface):
| Range (h) | jifto (m²) | jifto (%) | Autodesk Forma (%) | Ladybug Tools |
|---|---|---|---|---|
| 0 – 1 | 4,954 | 9% | +0.03% | Ladybug Tools does not report area by sun-hour band.* |
| 1 – 2 | 1,133 | 2% | -0.02% | |
| 2 – 3 | 1,518 | 3% | +0.02% | |
| 3 – 4 | 2,379 | 5% | +0.10% | |
| 4 – 5 | 4,530 | 9% | -0.11% | |
| 5 – 6 | 2,700 | 5% | +0.23% | |
| 6 – 7 | 3,705 | 7% | -0.14% | |
| 7 – 8 | 2,561 | 5% | +0.23% | |
| 8 – 9 | 3,303 | 6% | 0.00% | |
| 9+ | 25,698 | 49% | -0.34% | |
| Total | 52,480 | 100% | 0.00% |
*Ladybug's analysis mesh uses non-uniform face sizes, so band areas cannot be derived from its output.
Shadow
Equinox day – 20 March, 15:00

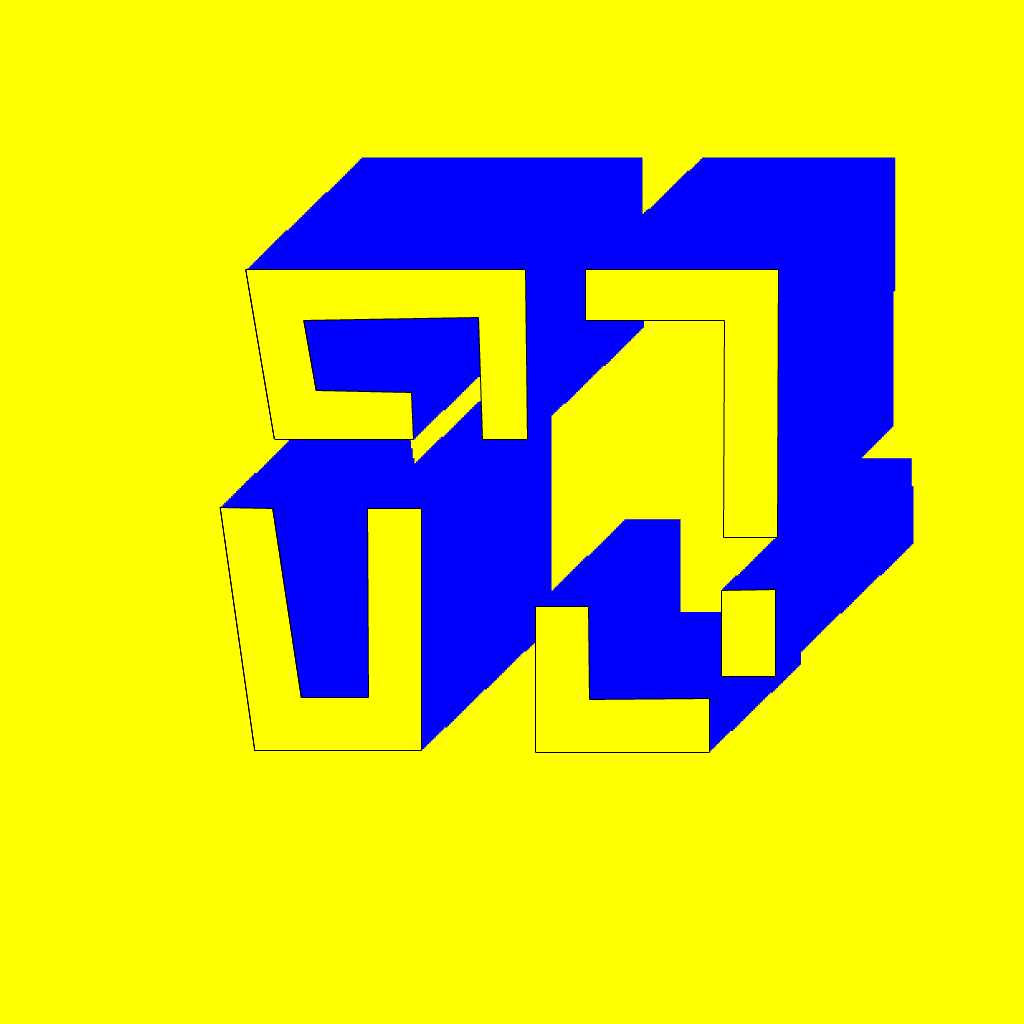
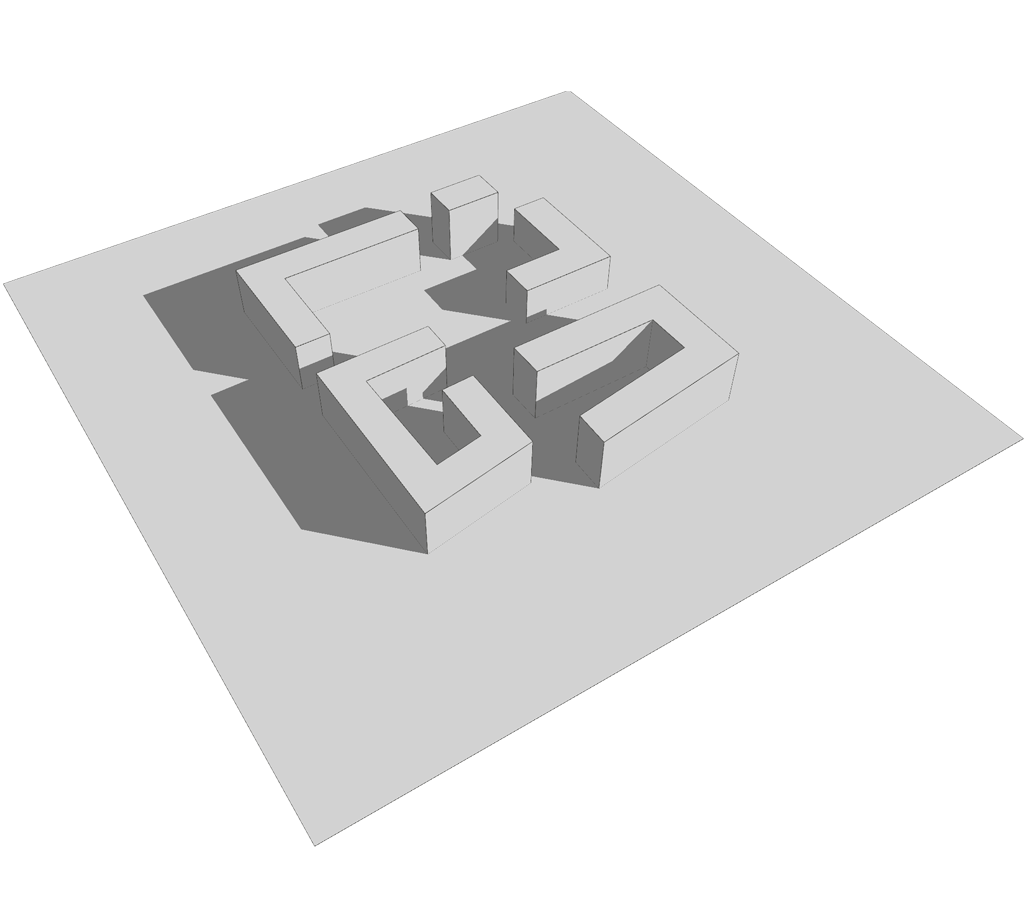
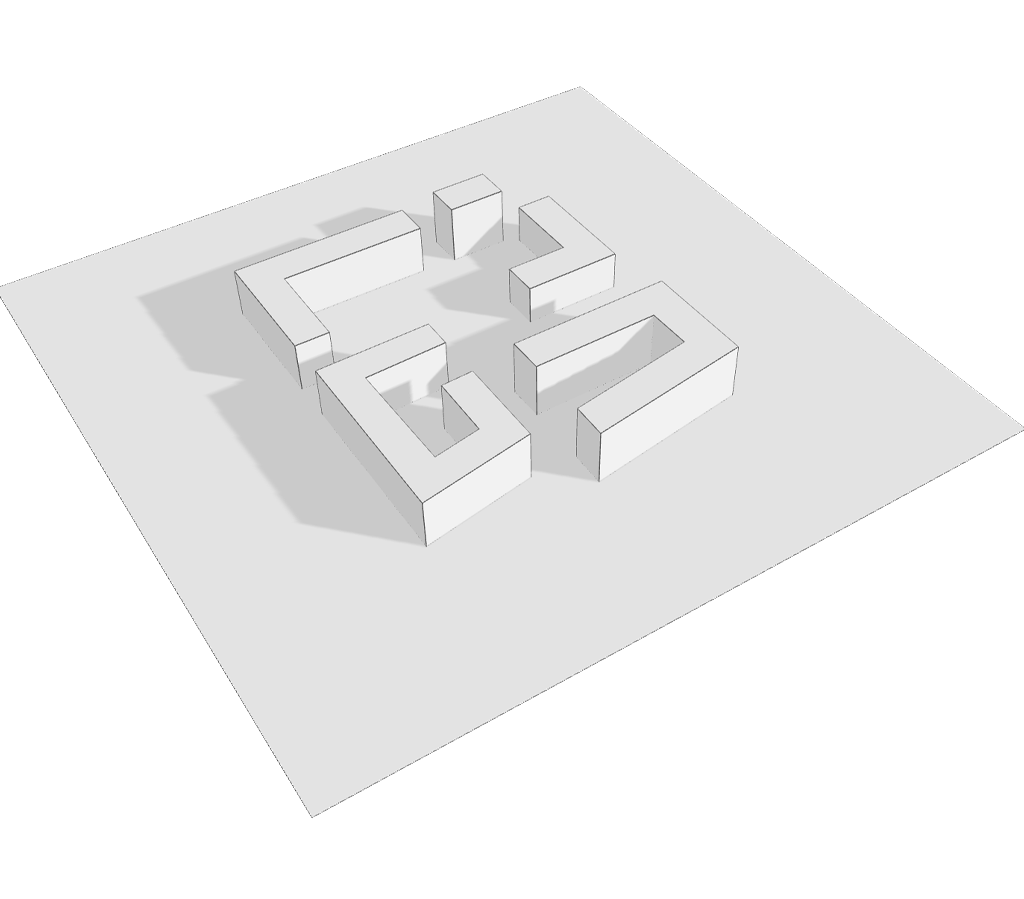
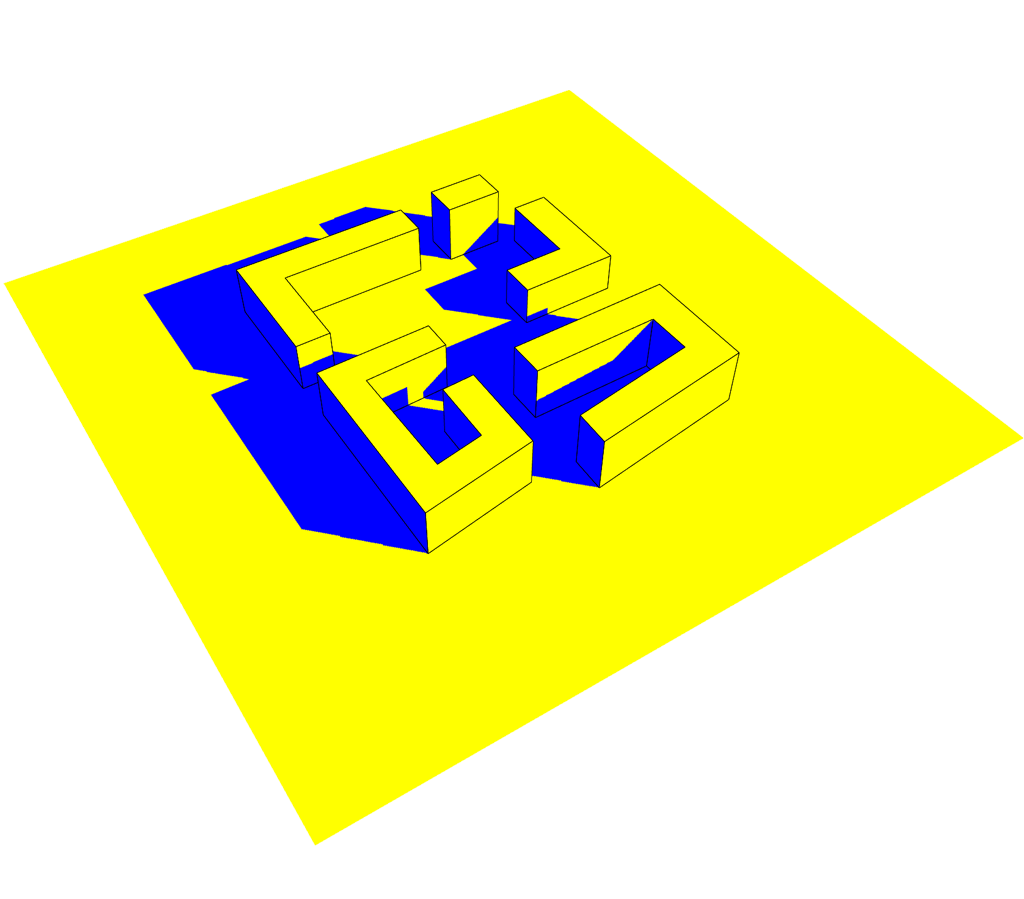
Area distribution by sunlit/shadowed classification (m² and % of total analysed surface):
| Statistic | jifto (m²) | jifto (%) | Autodesk Forma | Ladybug Tools |
|---|---|---|---|---|
| Shadowed | 15,264 | 29% | Does not report shadowed/sunlit area breakdown. | Does not report shadowed/sunlit area breakdown. |
| Sunlit | 37,216 | 71% | ||
| Total | 52,480 | 100% |
Energy
Annual results
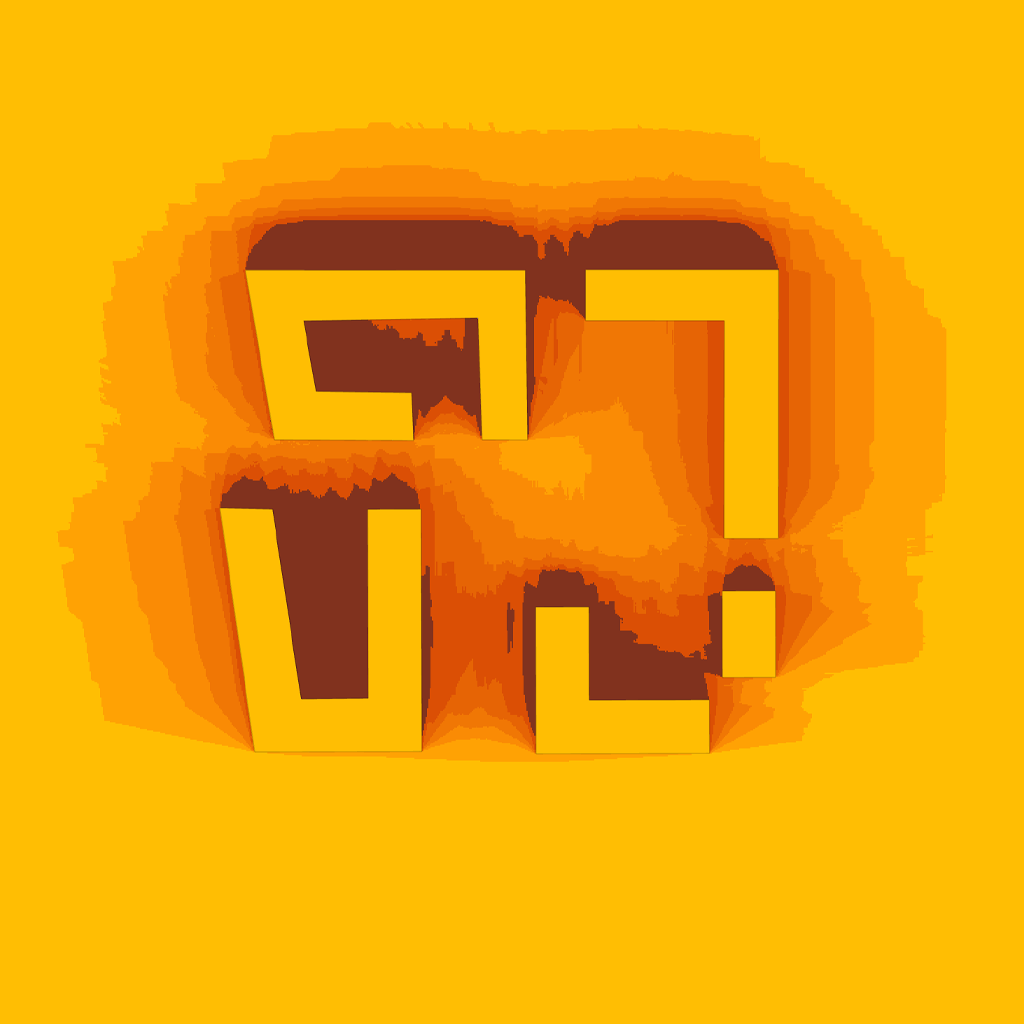
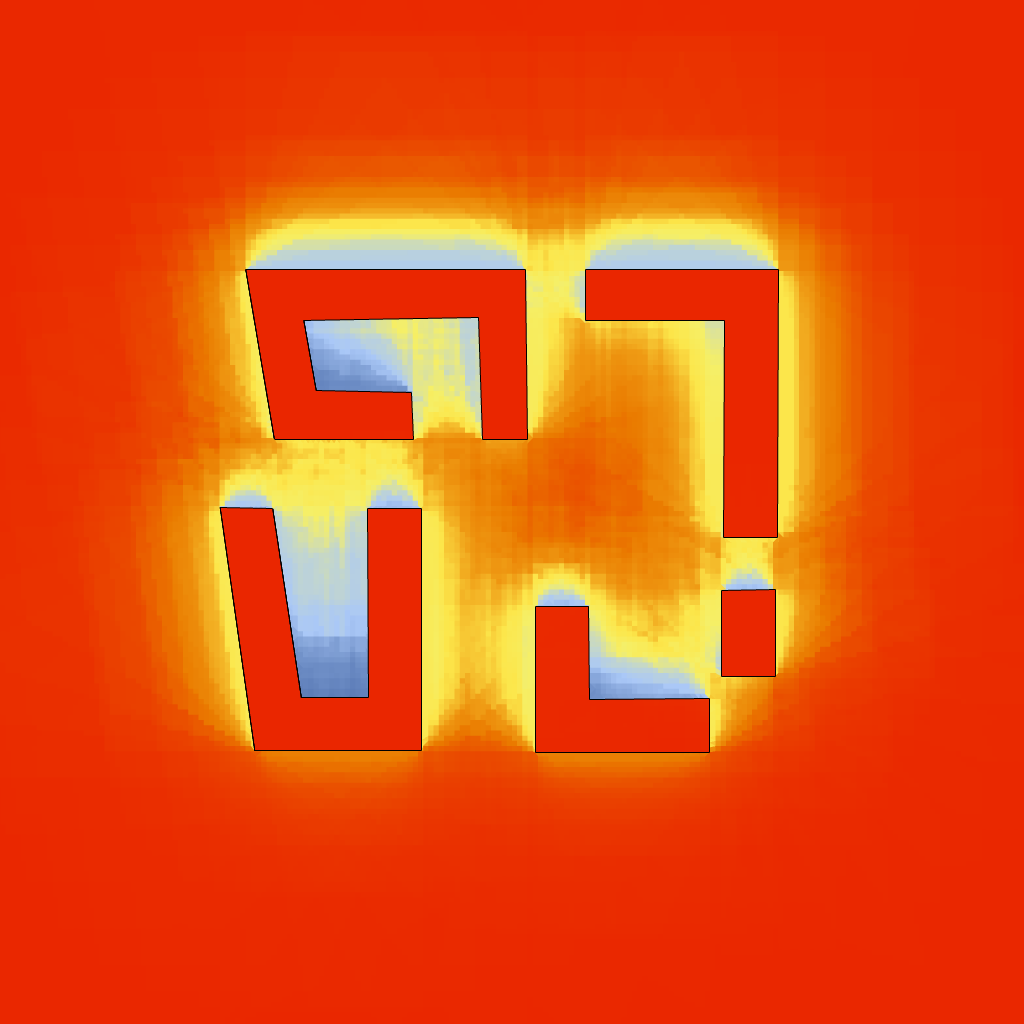
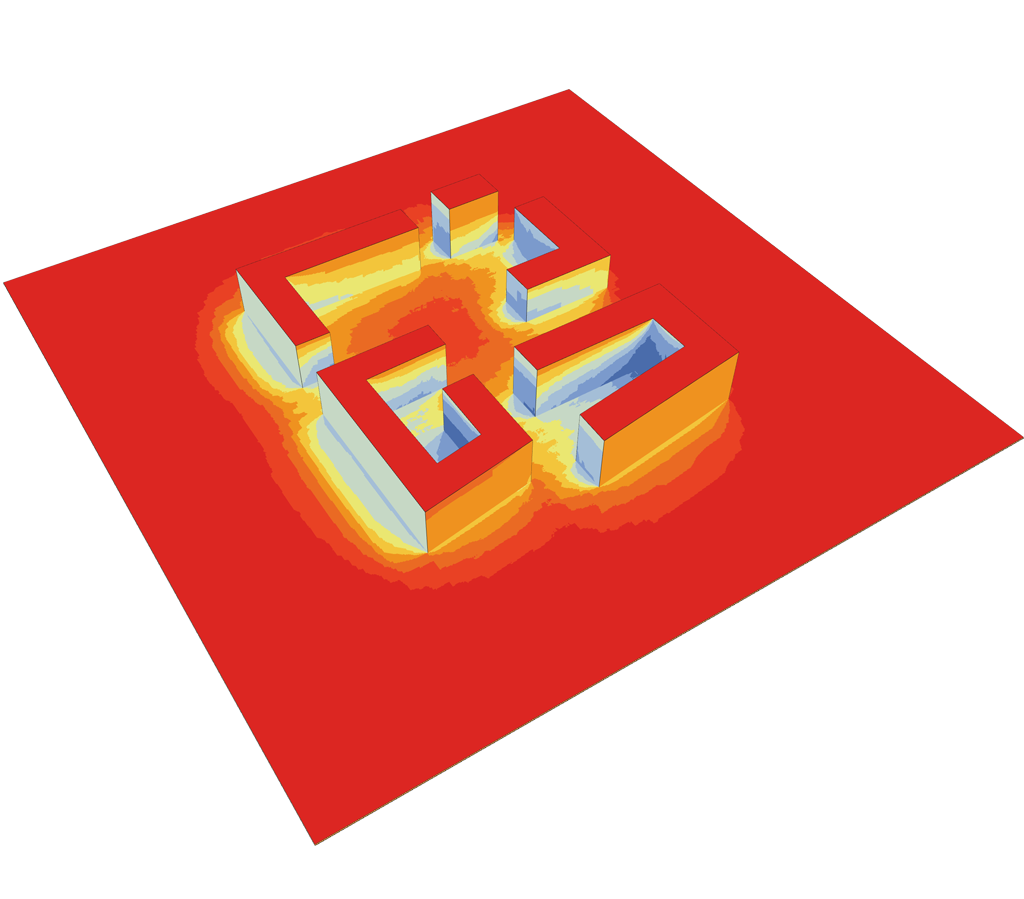
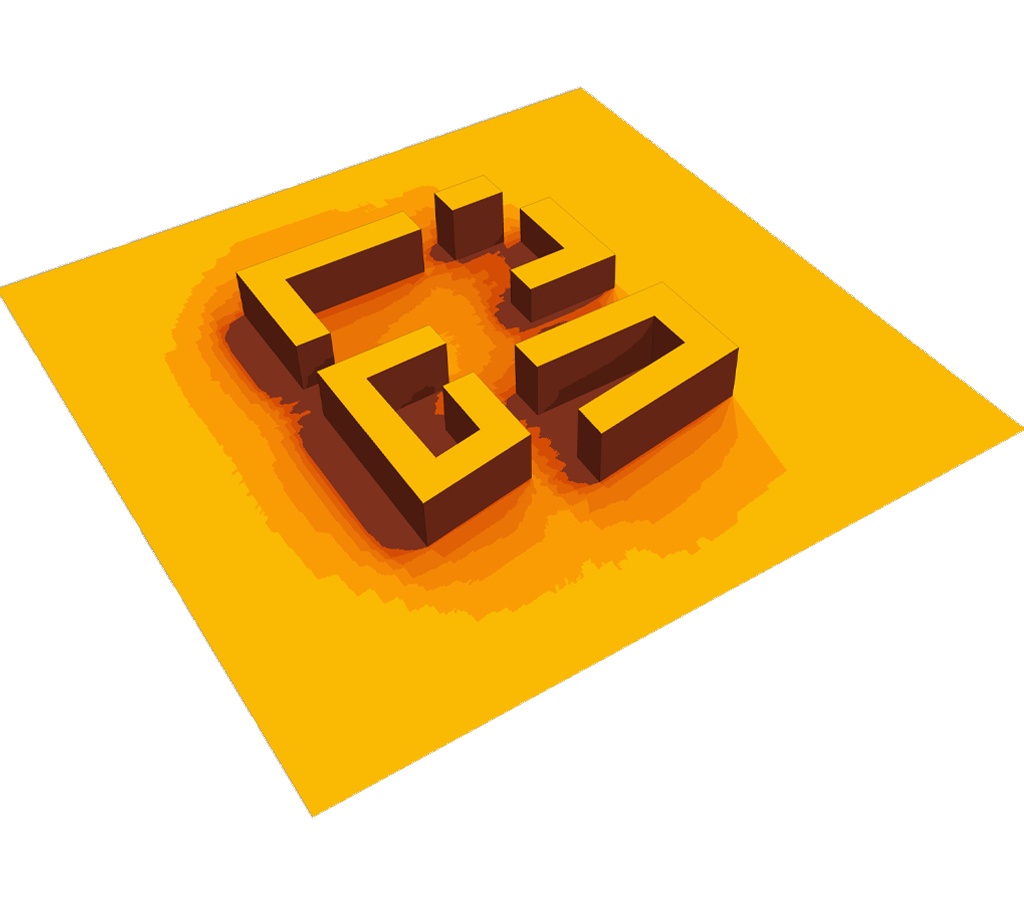
Area distribution by cumulative radiation band (m² and % of total analysed surface):
| Range (kWh/m²) | jifto (m²) | jifto (%) | Autodesk Forma | Ladybug Tools |
|---|---|---|---|---|
| 0 – 100 | 532 | 1% | Does not report area by energy band. | Does not report area by energy band. |
| 100 – 200 | 1,305 | 2% | ||
| 200 – 300 | 1,449 | 3% | ||
| 300 – 400 | 3,443 | 7% | ||
| 400 – 500 | 2,512 | 5% | ||
| 500 – 600 | 3,991 | 8% | ||
| 600 – 700 | 3,807 | 7% | ||
| 700 – 800 | 2,455 | 5% | ||
| 800 – 900 | 3,978 | 8% | ||
| 900+ | 29,008 | 55% | ||
| Total | 52,480 | 100% |
| Statistic | jifto | Autodesk Forma | Ladybug Tools |
|---|---|---|---|
| Total solar energy | 44,500,000 kWh | 39,163,000 kWh | |
| Average solar energy | 850 kWh/m² | 746 kWh/m² |
Possible questions
Quick answers about what jifto Sunlight measures, how it works, and what the default settings mean.
-
This document validates the computational approach used in jifto Sunlight, the direct sun analysis module of the jifto environmental analysis platform. Its purpose is to characterise accuracy, document assumptions, and provide a reference for the tool in regulatory or design-quality contexts.
-
Cumulative direct sun hours at each point on a surface for a selected day or season range, or shadow extents at a specific instant.
-
Sun hours: e.g. courtyards, terraces, play areas, window access, compliance checks.
Shadows: e.g. overshadowing disputes, arrival-point checks, winter-noon regulatory reviews. -
Sun hours: e.g. minimum sunlight hour thresholds.
Shadows: e.g. overshadowing tests -
Any geometry – surfaces, meshes, and polysurfaces or Breps.
-
1.0 m grid spacing – adjustable in Advanced Settings.
-
60 minutes – adjustable in Advanced Settings.
-
GPU-accelerated ray tracing. Rays are traced from each measurement point toward the sun position at each time sample.
-
Configurable for equinox, summer solstice, winter solstice, or a custom month, day, or date range.